Quarto enables you to weave together content and executable code into a finished document. To learn more about Quarto see https://quarto.org.
Running Code
When you click the Render button a document will be generated that includes both content and the output of embedded code. You can embed code like this:
library(tidyverse)
── Attaching core tidyverse packages ──────────────────────── tidyverse 2.0.0 ──
✔ dplyr     1.1.2     ✔ readr     2.1.4
✔ forcats   1.0.0     ✔ stringr   1.5.0
✔ ggplot2   3.4.2     ✔ tibble    3.2.1
✔ lubridate 1.9.2     ✔ tidyr     1.3.0
✔ purrr     1.0.1
── Conflicts ────────────────────────────────────────── tidyverse_conflicts() ──
✖ dplyr::filter() masks stats::filter()
✖ dplyr::lag()    masks stats::lag()
ℹ Use the conflicted package (<http://conflicted.r-lib.org/>) to force all conflicts to become errors
You can add options to executable code like this
mpg
# A tibble: 234 × 11
   manufacturer model      displ  year   cyl trans drv     cty   hwy fl    class
   <chr>        <chr>      <dbl> <int> <int> <chr> <chr> <int> <int> <chr> <chr>
 1 audi         a4           1.8  1999     4 auto… f        18    29 p     comp…
 2 audi         a4           1.8  1999     4 manu… f        21    29 p     comp…
 3 audi         a4           2    2008     4 manu… f        20    31 p     comp…
 4 audi         a4           2    2008     4 auto… f        21    30 p     comp…
 5 audi         a4           2.8  1999     6 auto… f        16    26 p     comp…
 6 audi         a4           2.8  1999     6 manu… f        18    26 p     comp…
 7 audi         a4           3.1  2008     6 auto… f        18    27 p     comp…
 8 audi         a4 quattro   1.8  1999     4 manu… 4        18    26 p     comp…
 9 audi         a4 quattro   1.8  1999     4 auto… 4        16    25 p     comp…
10 audi         a4 quattro   2    2008     4 manu… 4        20    28 p     comp…
# ℹ 224 more rows
The echo: false option disables the printing of code (only output is displayed).
This is a hello world document for using R in quarto. I love it very much.
Creating a ggplot
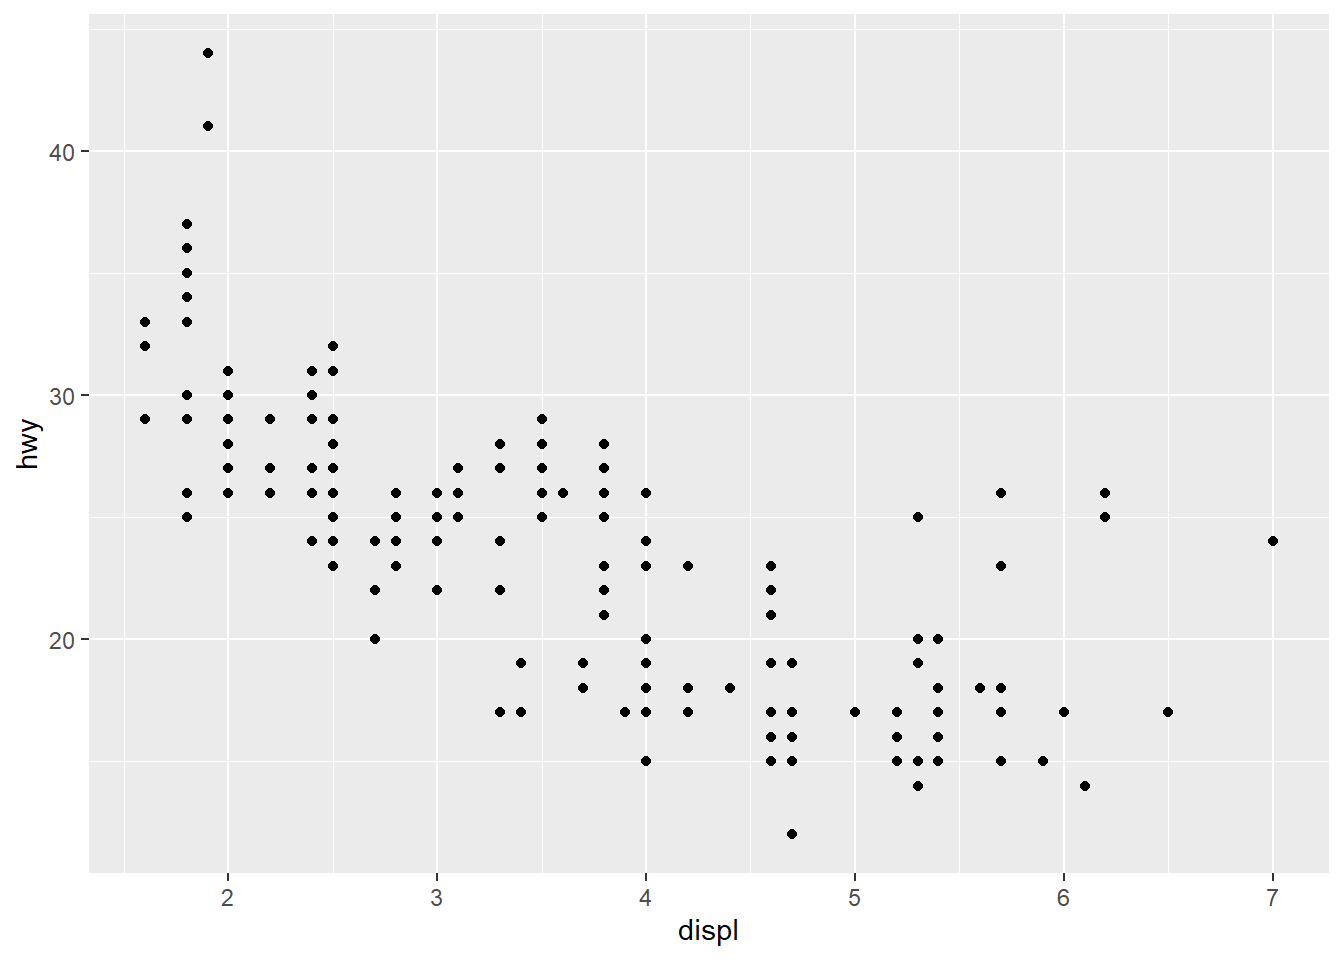
Creating the first ggplot with mpg data.
ggplot(data = mpg)+geom_point(mapping =aes(x = displ, y = hwy))
Run ggplot(data = mpg). What do you see?
We see an empty plot as below
ggplot(data=mpg)
How many rows are in mpg? How many columns?
nrow(mpg)
[1] 234
ncol(mpg)
[1] 11
dim(mpg)
[1] 234 11
What does the drv variable describe? Read the help for ?mpg to find out. drv -> the type of drive train, where f = front-wheel drive, r = rear wheel drive, 4 = 4wd
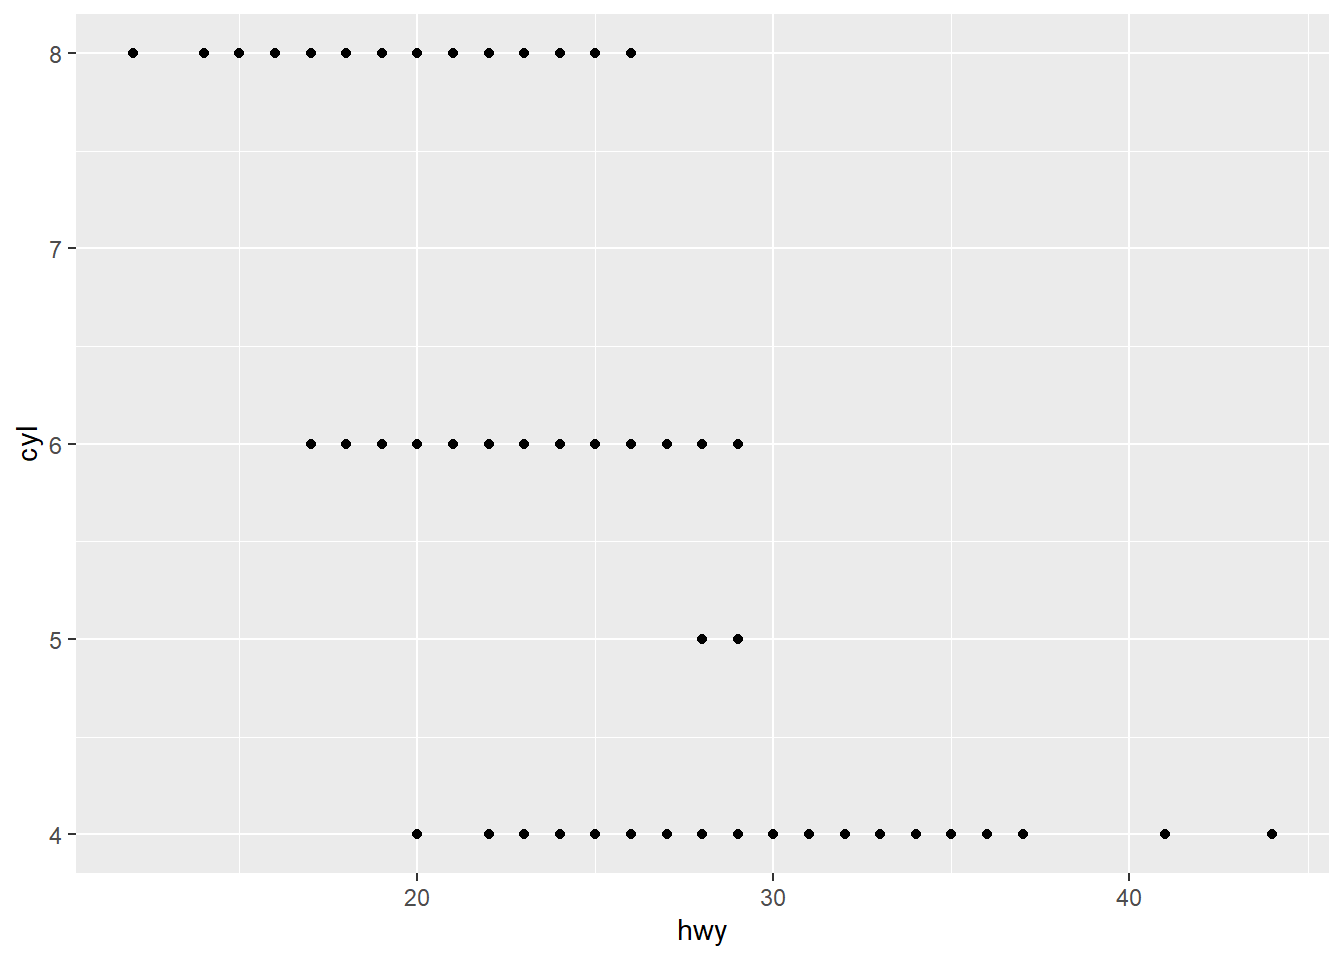
Make a scatterplot of hwy vs cyl.
hwy
highway miles per gallon
cyl
number of cylinders
ggplot(data=mpg)+geom_point(mapping =aes(x = hwy, y = cyl))
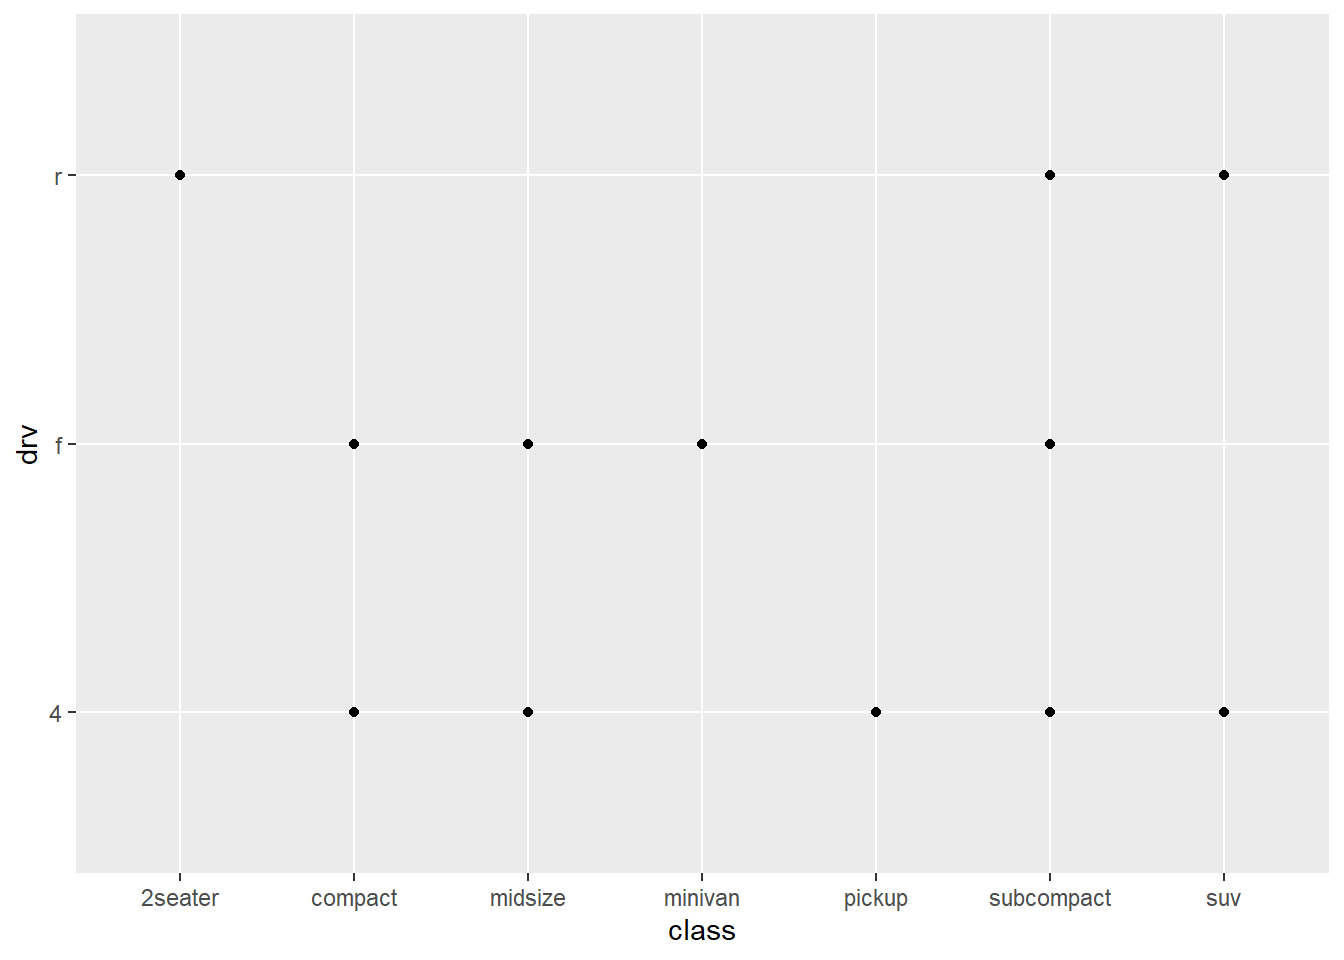
What happens if you make a scatterplot of class vs drv? Why is the plot not useful
drv
the type of drive train, where f = front-wheel drive, r = rear wheel drive, 4 = 4wd
class
“type” of car
ggplot(data=mpg)+geom_point(mapping =aes(x = class, y = drv))
There is no trend or any decipherable relationship between drv and class among different class categories.
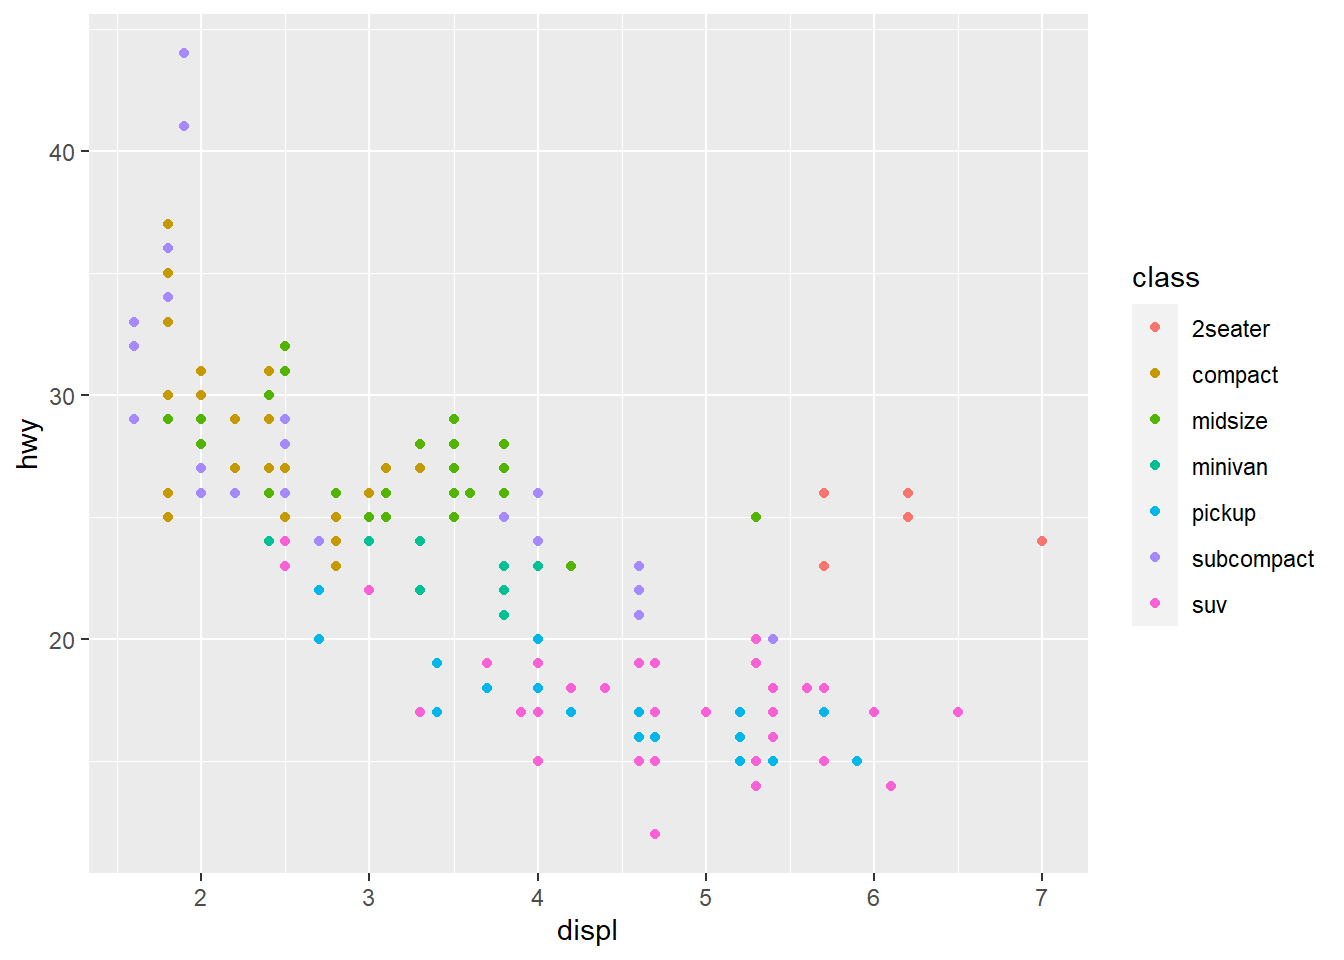
Aesthetics
ggplot(data = mpg)+geom_point(mapping =aes(x = displ, y = hwy, color = class))
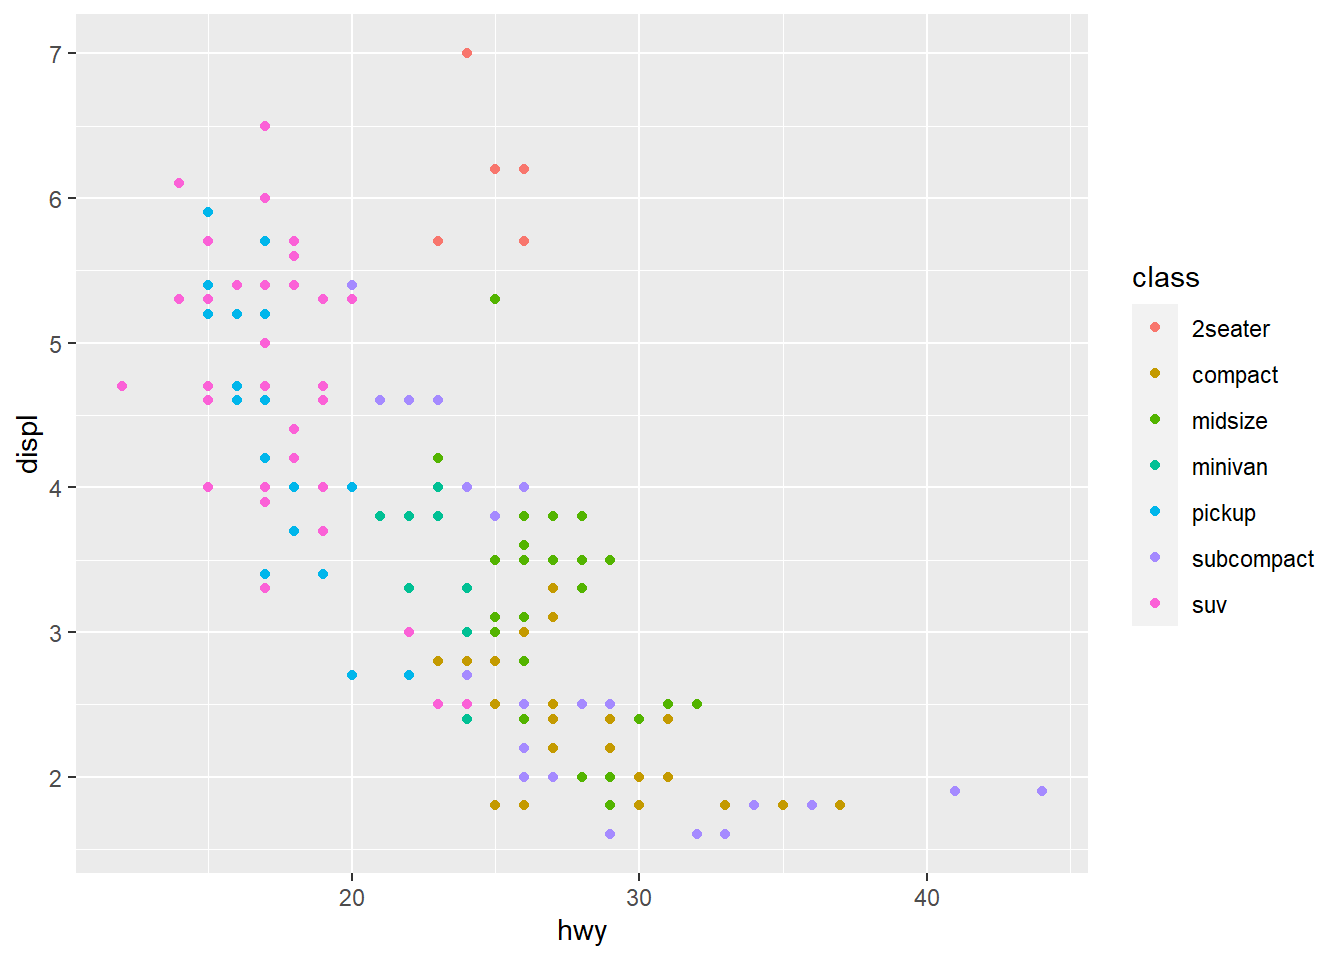
# Leftggplot(data = mpg) +geom_point(mapping =aes(x = hwy, y = displ, color = class))# Rightggplot(data = mpg) +geom_point(mapping =aes(x = displ, y = hwy, color = class))