import sklearn
Important
- What variables most affect our predictions
Imports
sklearn.__version__'1.5.0'from aiking.data.external import *
import numpy as np
import pandas as pd
from sklearn.model_selection import train_test_split
from sklearn.ensemble import RandomForestClassifier
from sklearn.inspection import permutation_importance
import seaborn as sns
import matplotlib.pyplot as plt
# import eli5Read Data
path = get_ds('fifa-2018-match-statistics'); path.ls()[0]Path('/Users/rahul1.saraf/rahuketu/programming/AIKING_HOME/data/fifa-2018-match-statistics/FIFA 2018 Statistics.csv')df = pd.read_csv(path/"FIFA 2018 Statistics.csv"); df
y = (df['Man of the Match'] == "Yes"); y
X = df.select_dtypes(np.int64); X
df_train, df_val, y_train, y_val = train_test_split(X, y, random_state=1)
df_train.shape, df_val.shape, y_train.shape, y_val.shape((96, 18), (32, 18), (96,), (32,))model = RandomForestClassifier(n_estimators=100,random_state=0).fit(df_train, y_train); modelRandomForestClassifier(random_state=0)In a Jupyter environment, please rerun this cell to show the HTML representation or trust the notebook.
On GitHub, the HTML representation is unable to render, please try loading this page with nbviewer.org.
RandomForestClassifier(random_state=0)
result = permutation_importance(model, df_val, y_val, n_repeats=30, random_state=42, n_jobs=2); result.keys()dict_keys(['importances_mean', 'importances_std', 'importances'])result.importances_meanarray([ 0.159375 , 0.00208333, -0.05 , 0.02083333, 0.03020833,
0.009375 , 0. , 0.003125 , 0.02083333, -0.00520833,
0.02916667, -0.05208333, 0.06145833, 0.01979167, 0.02395833,
0. , 0. , -0.00833333])result.importances_stdarray([0.07003998, 0.03864008, 0.04389856, 0.06002025, 0.02734251,
0.02440703, 0.03952847, 0.02835554, 0.03260932, 0.02562161,
0.02901748, 0.03054766, 0.03992452, 0.02962805, 0.02873565,
0. , 0. , 0.01381927])result.importances[0], len(result.importances[0])(array([0.1875 , 0.21875, 0.0625 , 0.1875 , 0.15625, 0.21875, 0.125 ,
0.09375, 0.21875, 0.03125, 0.15625, 0.125 , 0.21875, 0.09375,
0.15625, 0.09375, 0.09375, 0.25 , 0.03125, 0.1875 , 0.28125,
0.125 , 0.1875 , 0.0625 , 0.28125, 0.15625, 0.125 , 0.15625,
0.21875, 0.28125]),
30)def show_weights(result):
perm_sorted_idx = result.importances_mean.argsort(); perm_sorted_idx
feat_df = pd.DataFrame({'features':df_val.columns[perm_sorted_idx].tolist(),
'importance_mean': result.importances_mean[perm_sorted_idx],
'importance_std': result.importances_std[perm_sorted_idx] }).sort_values(by='importance_mean', ascending=False )
a = feat_df['importance_mean'].abs().max()
return feat_df.style.background_gradient(axis=0, gmap=feat_df['importance_mean'], cmap='RdBu', vmax=a, vmin=-a)
show_weights(result)| features | importance_mean | importance_std | |
|---|---|---|---|
| 17 | Goal Scored | 0.159375 | 0.070040 |
| 16 | Distance Covered (Kms) | 0.061458 | 0.039925 |
| 15 | Off-Target | 0.030208 | 0.027343 |
| 14 | Pass Accuracy % | 0.029167 | 0.029017 |
| 13 | Yellow Card | 0.023958 | 0.028736 |
| 12 | On-Target | 0.020833 | 0.060020 |
| 11 | Free Kicks | 0.020833 | 0.032609 |
| 10 | Fouls Committed | 0.019792 | 0.029628 |
| 9 | Blocked | 0.009375 | 0.024407 |
| 8 | Offsides | 0.003125 | 0.028356 |
| 7 | Ball Possession % | 0.002083 | 0.038640 |
| 6 | Red | 0.000000 | 0.000000 |
| 5 | Corners | 0.000000 | 0.039528 |
| 4 | Yellow & Red | 0.000000 | 0.000000 |
| 3 | Saves | -0.005208 | 0.025622 |
| 2 | Goals in PSO | -0.008333 | 0.013819 |
| 1 | Attempts | -0.050000 | 0.043899 |
| 0 | Passes | -0.052083 | 0.030548 |
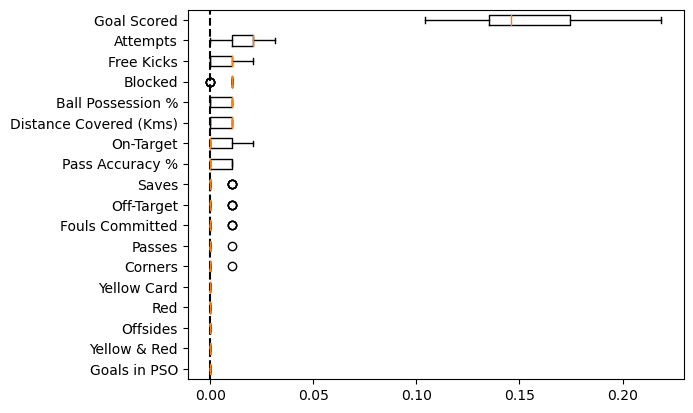
def show_plot(result, ax):
    perm_sorted_idx = result.importances_mean.argsort(); perm_sorted_idx
    ax.boxplot(
        result.importances[perm_sorted_idx].T,
        vert=False,
        labels=X.columns[perm_sorted_idx],
    )
    ax.axvline(x=0, color="k", linestyle="--")
    return ax

ax = plt.subplot(111)
show_plot(result, ax)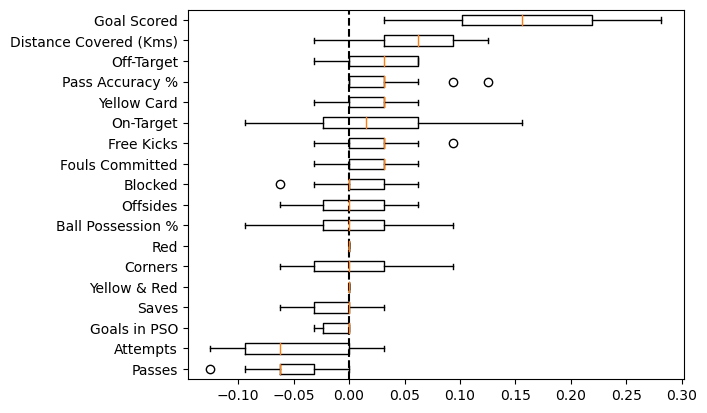
Important
Feature which are negative imply that, validation score of model is better on shuffled feature than in the original set. This means feature importance of these features are zero. Reason why we see negative is only due to some random chance.
Unsurprisingly goal scored is most important predictor for man of the match
What if we run this on train data?
result_train = permutation_importance(model, df_train, y_train, n_repeats=30, random_state=42, n_jobs=2); result_train.keys()dict_keys(['importances_mean', 'importances_std', 'importances'])show_weights(result_train)| features | importance_mean | importance_std | |
|---|---|---|---|
| 17 | Goal Scored | 0.151736 | 0.025328 |
| 16 | Attempts | 0.017361 | 0.008646 |
| 15 | Free Kicks | 0.008681 | 0.006634 |
| 14 | Blocked | 0.008681 | 0.003882 |
| 13 | Ball Possession % | 0.007292 | 0.004774 |
| 12 | Distance Covered (Kms) | 0.006944 | 0.004910 |
| 11 | On-Target | 0.005208 | 0.006449 |
| 10 | Pass Accuracy % | 0.004861 | 0.005197 |
| 9 | Saves | 0.001736 | 0.003882 |
| 8 | Off-Target | 0.001389 | 0.003541 |
| 7 | Fouls Committed | 0.001042 | 0.003125 |
| 6 | Passes | 0.000347 | 0.001870 |
| 5 | Corners | 0.000347 | 0.001870 |
| 1 | Yellow & Red | 0.000000 | 0.000000 |
| 4 | Yellow Card | 0.000000 | 0.000000 |
| 3 | Red | 0.000000 | 0.000000 |
| 2 | Offsides | 0.000000 | 0.000000 |
| 0 | Goals in PSO | 0.000000 | 0.000000 |
ax = plt.subplot(111)
show_plot(result_train, ax=ax)